During the great recession, the real consumption of Dutch households fell by no less than seven percent. To what extent is this due to mortgage debts and the fall in house prices?
In Brief
– Of the seven percent decrease in consumption, six percentage points are due to households with a high mortgage debt.
– Households with underwater mortgages account for two thirds, namely four percentage points.
– The fall in house prices plays an indirect role in the fall in consumption. The direct effects are one percentage point.
In het kort
This article is based on Zhang (2019) and Ji et al. (2019) and was published originally in Dutch here.
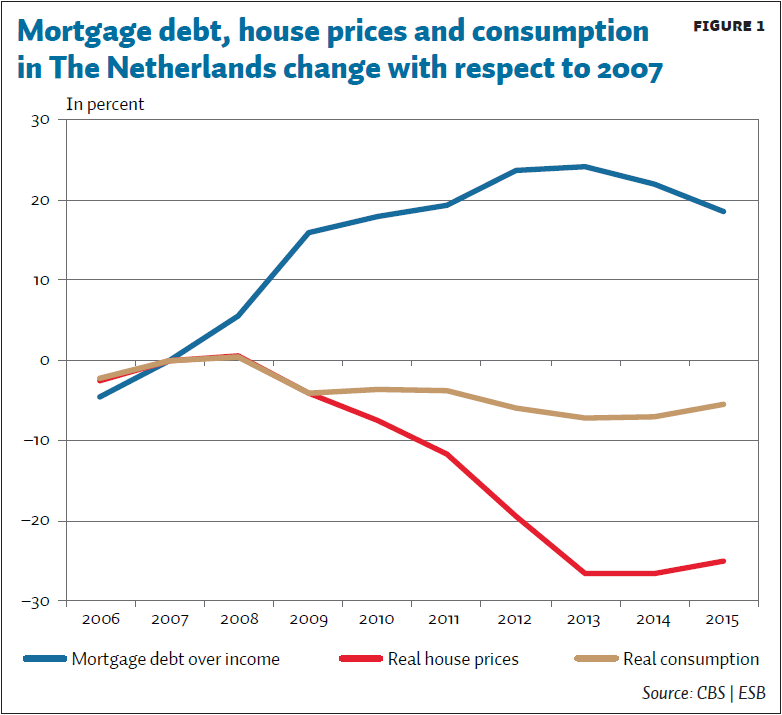
In 2013, real consumption of Dutch households was 7 percent lower than before the great recession (Figure 1). Often this decrease in consumption is associated with the sharp fall in house prices – the real house price level was 27 percent lower in 2014 than in 2008. With falling house prices household wealth decreases, and therefore the possibility to consume out of wealth.
Others however, frequently mention the length of the household balance sheets. Dutch households have an average debt of around 250 percent of their net disposable income. That is, apart from Denmark, the highest of all OECD countries. For example, according to Lukkezen and Elbourne (2015), these lengthy balance sheets explain the relatively sharp decrease in consumption during the great recession. The question is therefore whether there is a connection at the household level between falling house prices, high debts and a decrease in consumption. We will try to answer this question on the basis of two new papers.
Effects of a fall in house prices
The isolated effect of a fall in house prices is related to a fall in household consumption, but this correlation appears to be less strong than is often assumed at the macro level (Zhang, 2019). A fall in real house prices of ten percent in the short term is accompanied by an average drop of 0.4 percent in consumption. Bijlsma and Mocking (2017) find in a similar study that falling house prices have a limited but measurable impact on the savings of Dutch households.
Lower housing wealth can influence consumption via two main channels: via the ‘pure’ wealth effect (a reduction in capital leads to less consumption), and via borrowing restrictions – after all, housing wealth can serve as collateral for a loan (for example a mortgage). A possible third channel is precautionary savings, but they are difficult to distinguish from the borrowing restrictions if we do not look explicitly at the debt side of the household balance sheet.
The “pure” wealth effect appears to play a role in the decline in household consumption as Zhang (2019) shows. The consumption of homeowners is falling by 0.7 percent at the same time as a fall in house prices by ten percent, while this effect is negligible for tenants. This means that for every one euro drop in housing wealth, homeowners reduce their consumption by two cents. These results are in line with the international literature, in which homeowners, after a change in housing wealth by one euro, adjust their consumption in the same direction by one to three cents (see, for example, Atalay et al. (2014) for Australia and Canada; Gan ( 2010) for Hong Kong; and Paiella and Pistaferri (2017) for Italy).
Borrowing restrictions play an even greater role in addition to the “pure” wealth effect. Due to falling house prices, households can borrow less because they have less collateral at their disposal. Many households have limited liquid assets to be able to accommodate setbacks (the median household has only 15,000 euros). This has consequences for consumption, for example because shocks in income immediately have an effect on consumption. Simultaneously with a fall in house prices of ten percent, the consumption of homeowners with little cash or debts falls by 1 to 1.4 percent, while for homeowners with a lot of cash or low debts this is about 0.4 percent. The first group usually consists of households that are at or close to their borrowing limit. These results seem to indicate that borrowing restrictions or debts are a more important channel than the “pure” wealth effect.
Despite these results, only one percentage point of the fall in real consumption of 7 percent can be explained by the direct effect of a fall in house prices. But this does not exclude that the fall in house prices might be indirectly related to the fall in consumption. A possible indirect interaction is via households with high mortgage debts, where a fall in house prices can lead to the house being worth less than the mortgage on the house (this is called an underwater mortgage). For the United States, Mian and Sufi (2013) show that falling house prices have a negative impact on consumption, particularly with regard to households with high debts. These results provide a starting point for further research.
The effect of debts on consumption
In the second study we therefore look at the relationship between the liability side of the household balance sheet and household consumption (Ji et al., 2019). We do this by comparing consumption patterns of households with relatively high debts with households with low debts at the time of the great recession. There are many international indications that debts play an important role in household consumption. For example, Baker (2018) shows that the higher the household debt level, the greater the fall in consumption during a crisis. For the Netherlands, little other research has been done at household level into the effects of debts on household consumption.
We compare the development of consumption of households with a high mortgage debt with that of other households. We define households with a high mortgage debt, independently of the level of house prices, as the 25 percent households with the highest debt to income ratio – the average for this group is 5.7. The other households have an average debt-to-income ratio of 0.7.
Within the group of households with high debts, we then pay special attention to households whose homes are underwater. The share of households with an underwater mortgage and high debts has risen sharply due to the sharp fall in house prices during the great recession, from twenty percent in 2007 to sixty percent in 2014. For comparison, the share of households an underwater mortgage in the group with low debt rose from one to three percent.
We not only look at the effect of high debts on household consumption, but also whether this changes over time as a result of the great recession due to, for example, a fall in income or a greater chance of unemployment (Figure 2). Decline in house prices can also continue to play an indirect role through high debts, especially for households whose homes are underwater. Finally, in the underlying research (Ji et al., 2019) we include the change in the composition of the group of households with high debts, such as the increasing number of underwater mortgages.
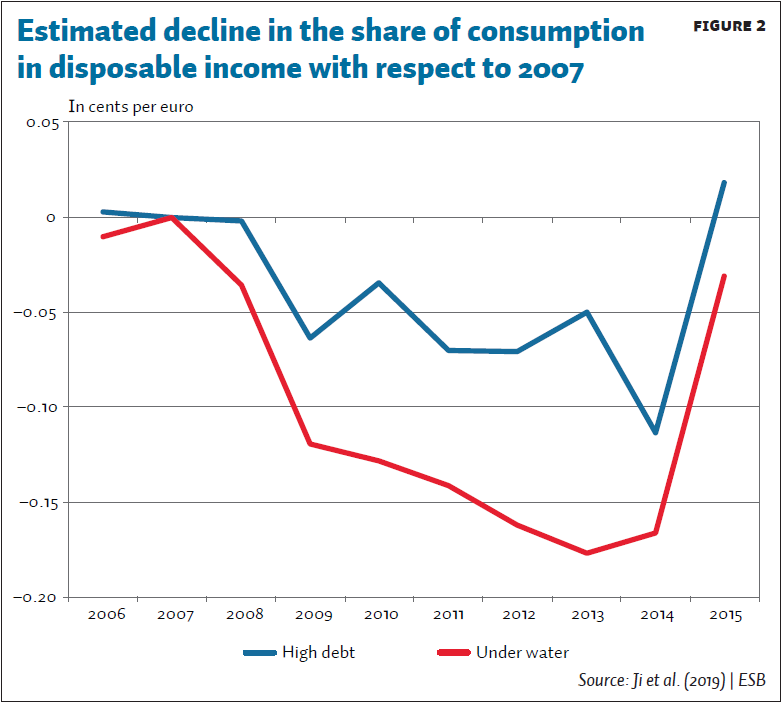
Households with high mortgage debts have greatly reduced their consumption in times of crisis. Their home with a mortgage is often underwater by lower house prices. At its deepest point in 2014, they consumed, at the deepest point, eleven cents per euro less of their average disposable income than households with high debts did in 2007 (Figure 2). Before the big recession, these households consumed more than households with a relatively low mortgage debt. During the great recession, the consumption of households with high mortgage debts fell sharply towards the level of households with low mortgage debts, while the latter group barely adjusted their consumption level.
This relationship between debt and consumption can be explained through three different channels. Two have to do with the level of the debt: precautionary savings due to risk aversion and borrowing restrictions. A third has to do with the change in debt, the so-called consumer credit effect.
Precautionary savings (the first channel) can depend on debt levels and thus influence consumption. Households are exposed to more risks at the time of a crisis, such as losing their job, a decrease in their income or changes in government policy. High-risk households see the consequences of the crisis in their environment and the uncertainty they experience increases. This can make households decide to consume less and instead save more or pay off their (mortgage) debt – even if they have not (yet) had borrowing restrictions or an actual shock in their income or assets (Caroll et al. , 2012; Challe and Ragot, 2016; Guerrieri and Lorenzoni, 2017). Precautionary savings are likely to be greatest among households with high mortgage debts whose homes have already been underwater or that have been underwater as a result of the fall in house prices, because the potential consequences of a shock are greatest for them. At the deepest point they therefore consume eighteen cents per euro of their average disposable income less than the same subgroup did in 2007 (Figure 2).
The second channel (loan restrictions for households with high mortgage debts) does not seem to play a very large role. Households with high mortgage debts and little financial resources (this includes savings, shares and bonds) do not behave differently from households with high mortgage debts and a lot of financial resources. So there is no reason to assume that borrowing restrictions play an important role for this group of households.
The third possible channel is via consumer credit (Andersen et al., 2016). Before the major recession, households who move borrowed additional funds to pay for one-off expenses, such as a new kitchen. In the following years they brought their consumption back to the old level. But during the major recession, households who moved seemed to be less willing and / or less able to finance additional expenses with debt. At the deepest point they therefore consume 23 cents per euro less of their average disposable income than the same subgroup did in 2009. Therefore, households who moved during the recession are making less use of consumer credit, which could partly explain a decrease in consumption during the major recession. But at the macro level, the number of households that move every year is actually small at around six percent, and so consumer credit has a limited impact.
The effect on macro consumption
The decrease in consumption is only partly explained by the direct effect of the decrease in housing wealth (Figure 3). A 10 percent fall in real house prices means households are reducing their consumption by 0.4 percent. If we take into account a fall in house prices of 27 percent, then the fall in housing wealth can explain one percentage point of the observed real macro-fall in consumption of 7 percent. This estimate does not take into account possible indirect effects, in which also the interactions between households can play a role.
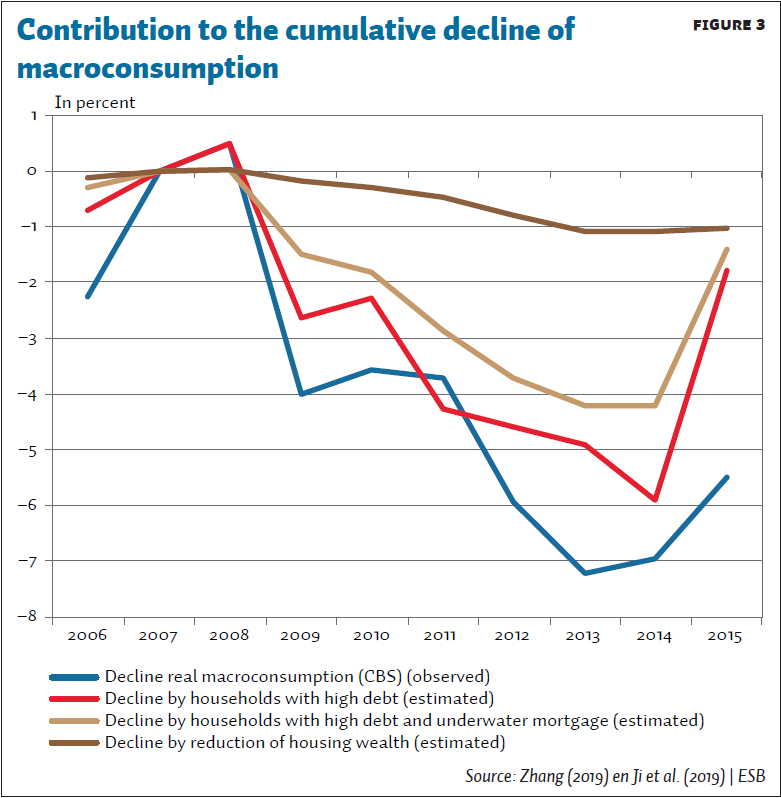
The decrease in consumption of households with high mortgage debts in combination with the indirect effect of a fall in house prices has had a much larger share in the decrease in consumption at the national level. If households with high debts had behaved in the same way during the major recession as before, then total macro-consumption would be six percentage points higher. Within this group, especially households with a house that was already underwater, or that have came underwater during the great recession, have an important share of four percentage points. Precautionary savings appear to be the most important underlying channel for these households, where increased housing and unemployment risks may have played a role in addition to the fall in house prices (Ji et al., 2019).
In order to get an idea of how we have come to this decrease of six percentage points in our research, we provide a simple but incomplete example. In 2014, households with high debts consume eleven cents per euro of their average disposable income less than households with high debts in 2007 (Figure 2). In addition, sixty percent of households with high debts have their house under water. For this subgroup, consumption in 2014 is seventeen cents per euro of their average disposable income lower than for the same group in 2007. The weighted average decrease in 2014 of households with high debts is therefore fifteen cents per euro of their average disposable income in 2007. In 2007, this group consumes 35 percent of the total real macro-consumption. With an average decrease of fifteen cents per euro in their average disposable income, the total macro consumption in this calculation example falls by 5.1 percent. Note that, at the time of the great recession, households with low debts do not adjust their consumption.
As there is a large overlap between households with high debts and households with housing assets, it is impossible to add together the impact on the macro consumption of these two groups. Therefore, there are other causes that can explain part of the observed macro-consumption decline, but with the current data it is not possible to conduct further research into this (see box).
Box 1: Importance of a better measurement of consumption
In the studies, we approximate consumption per household by using administrative data at the household level on income and wealth. The consumption of a household equals its disposable income minus its savings. The savings are approximated by the change in assets. Unfortunately, the assets also change due to price changes of assets and donations, which means that the approach is not perfect.
It would be very useful if more reliable data on consumption at the household level were available for the Netherlands. To do this, it is necessary to improve the measurement of donations and investment profits on assets. In Sweden, the statistical office has observations on all investment portfolios of households (at ISIN level). This makes it much better to estimate what the investment gains have been, and what part of the capital increase was caused by savings. Millions of households in America use apps that combine all their financial data. This is also useful for research (Baker, 2018). In their study, Spiegelaar and Lennartz (2018) use data on payment accounts from Rabobank, which is potentially a very pure measure of consumption. But in their research they only have access to a limited proportion of consumers, and furthermore no insight into whether consumers still have payment accounts at other banks. Zhang (2019) uses the purchase of a car as a proxy. The disadvantage is that there is little variation in the data, since only five percent of households buy a car every year. Finally, survey data on household consumption is also a good alternative. It is, however, important that households are followed over a longer period and that the surveys are performed in a consistent manner over the years.
Conclusion
Real consumption of Dutch households fell sharply by seven percent during the great recession. The link between the direct effect of the decline in home wealth and the decline in household consumption appears to be limited. Homeowners reduce their consumption by two cents for every euro of depreciation in the value of their house. The decrease in housing wealth can explain one percentage point of the decrease in real macro consumption.
It appears that a large part of the decrease in consumption is related to the high (mortgage) debts of households in combination with the indirect effect of the fall in house prices. Highly indebted households reduce their consumption at the height of the great recession by eleven cents per euro of their average disposable income compared to comparable high-debt households in 2007. For homeowners with a house that was already underwater or came underwater during the crisis, the fall in consumption is even greater compared to 2007. with a decrease of seventeen cents per euro of their average disposable income, If these households had behaved in the same way during the great recession as before, then total consumption would have been six percentage points higher.
Literature
Andersen, A.L., C. Duus and T.L. Jensen (2016) Household debt and spending during the financial crisis: evidence from Danish micro data. European Economic Review, 89, 96–115.
Atalay, K., S. Whelan and J. Yates (2014) House prices, wealth and consumption: new evidence from Australia and Canada. The Review of Income and Wealth, 62 (1), 69–91.
Baker, S.R. (2018) Debt and the response to household income shocks: validation and application of linked financial account data. Journal of Political Economy, 126 (4), 1504–1557.
Bijlsma, M. and R. Mocking (2017) The impact of house price shocks on the savings of Dutch homeowners and renters. CPB Discussion Paper, 346.
Caroll, C.D., J. Slacalek and M. Sommer (2012) Dissecting saving dynamics: measuring wealth, precautionary, and credit effects. ECB Working Paper, 1474.
Challe, E. and X. Ragot (2014) Precautionary saving over the business cycle. The Economic Journal, 126 (590), 135–164.
Gan, J. (2010) Housing wealth and consumption growth: evidence from a large panel of households. The Review of Financial Studies, 23 (6), 2229–2267.
Guerrieri, V. and G. Lorenzoni (2017) Credit crises, precautionary savings, and the liquidity trap. The Quarterly Journal of Economics, 132 (3), 1427–1467.
Ji, K., R. Teulings and B. Wouterse (2019) Disentangling the effect of household debt on consumption. CPB Discussion Paper.
Lukkezen, J. and A. Elbourne (2015) Dutch consumption: good times, bad times. CPB Policy Brief, 2015/03.
Mian, A., K. Rao and A. Sufi (2013) Household balance sheets, consumption, and the economic slump. The Quarterly Journal of Economics, 128 (4), 1687–1726.
Paiella, M. and L. Pistaferri (2017) Decomposing the wealth effect on consumption. The Review of Economics and Statistics, 99 (4), 710-721.
Spiegelaar, L. and C. Lennartz (2018) Consumption of homeowners reacts strongly to rising house prices, especially in North Holland. Theme Report, Rabobank / Rabo Research, available at economy.rabobank.com.
Zhang, L. (2019) Do house prices matter for household consumption? Evidence from Dutch administrative data. CPB Discussion Paper.
Auteurs
Categorieën